Sampling
Context
Image Editor > Sidebar > MacBlend
MacBlend samples the 24 patches of the selected ColorChecker Classic (after 2014) or SpyderCheckr 24 model from Blender’s decoded, scene-linear image data. The image Color Space must therefore describe the source file correctly.
Chart Overlay
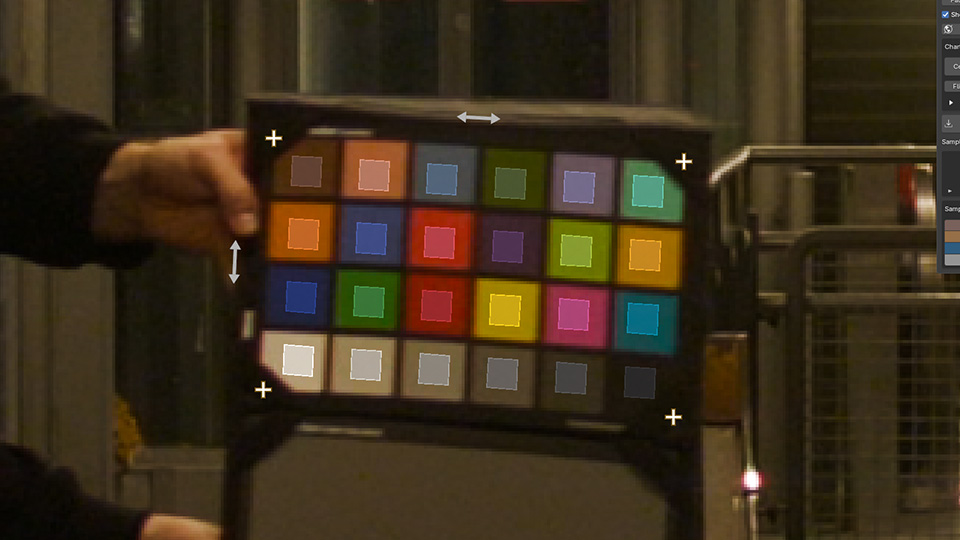
Chart overlay aligned to the outer corners of a Macbeth ColorChecker.
Show Overlay : Shows the selected chart model’s overlay in the Image Editor. It is initialized in the center of the image with a patch size of 40 by 40 pixels. Later toggles preserve edits.
Chart Type : Selects ColorChecker Classic (after 2014) or SpyderCheckr 24. Changing this dropdown switches the overlay order and sampling positions to match the selected physical chart while preserving the current overlay alignment.
Patch Size : Sets the size of the patches used for sampling, in image pixels. When Sample Chart is used, MacBlend averages the pixels inside each patch. Larger patches average more pixels, but must remain inside the chart’s colored areas.
Overlay Opacity : Controls the opacity of the color swatches shown inside the chart overlay. Before the image has been sampled, the swatches show built-in sRGB reference colors; afterward, they show the stored sampled colors. This setting affects only the overlay display, not the sampled values.
Flip Horizontal, Flip Vertical : Reverses the overlay orientation when the photographed chart is rotated or mirrored.
Center Overlay : Re-initializes the chart overlay in the current Image Editor view. Patch Size is recalculated as a result.
Reset Chart : Restores the initial image-space position and patch size.
Corner Positions : Exposes image-space coordinates for the four handles.
Mouse Controls
Dragging a handle moves one corner. The following modifiers remain available after the drag has started:
Wheel : Scales the chart around the active corner.
Ctrl : Moves all four corners together.
Ctrl-Alt and horizontal drag : Rotates the chart around the active corner.
Shift : Enables precision movement or rotation.
Note
Keep every visible sample region away from patch borders, glare, shadows, reflections, and chart damage.
Lat-Long Projection
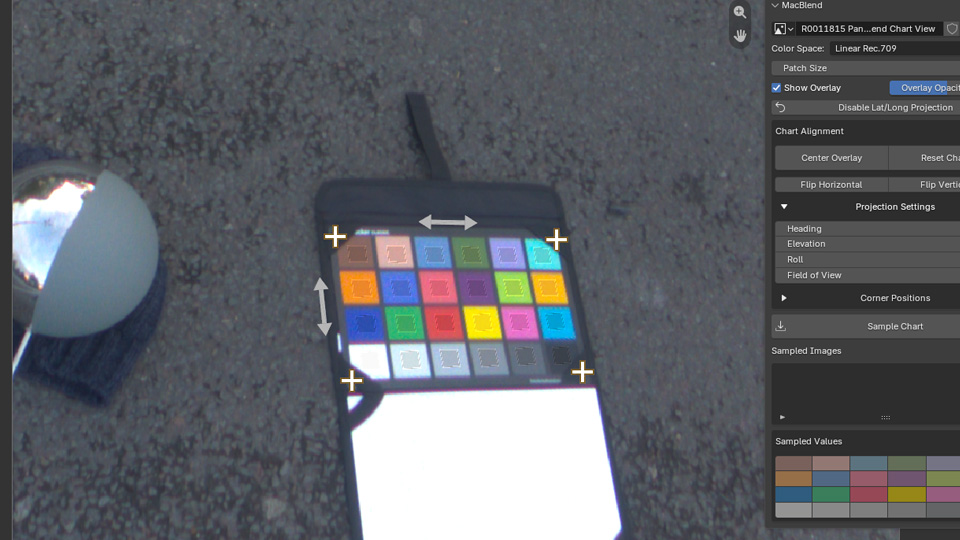
Rectilinear chart view projected from an equirectangular image.
Lat/Long Projection creates an undistorted rectilinear view centered on the chart’s middle axis. Useful for sampling 360 HDRI images.
Heading, Elevation, Roll, Field of View : Adjust the projected view.
Disable Lat/Long Projection : Returns to the original image and removes the temporary projection.
Projection settings and the final Patch Size are stored with the samples on the original image.
Alignment Checks
Before creating or leaving a Lat-Long view, and before sampling, MacBlend checks the chart alignment. A warning explains any issue and lets you abort to correct it or continue deliberately.
Reset the chart and use Flip Horizontal or Flip Vertical if the patch order is reversed.
Align tightly around the colorchart. A chart that fills a very wide panorama produces an impractical rectilinear field of view; the warning shows its angular coverage.
Keep the four chart corners close to right angles. Strongly irregular geometry could indicate the presence of glare and Fresnel reflections on the patches which can make sampled values inaccurate.
Reduce Patch Size or realign if sample regions reach outside the image.
Important
Moving the overlay in the flat image resets the sampling area. Sample a lat-long image’s chart in the projected lat-long view to avoid sampling incorrect areas.
Sample Chart
Sample Chart averages each projected sample region, stores 24 RGB values on the image, and hides the overlay. Sampling the same image again replaces its previous values.
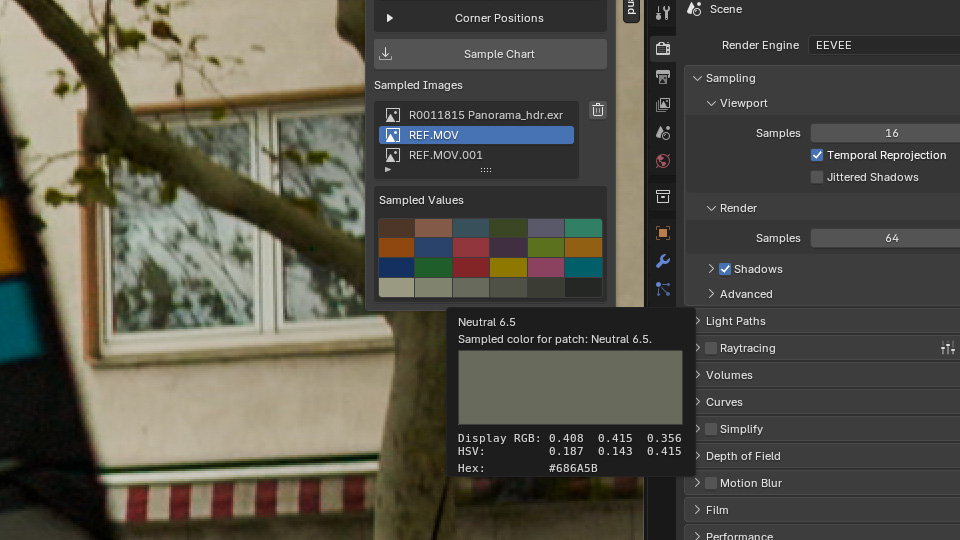
Measured patches for the selected sampled image.
Sampled images become available as calibration sources and targets. Removing an entry clears its samples and any active source or target selection that uses it.
Important
The display transform does not affect sampled values. Changing the image input Color Space does; sample the chart again after changing it.